



 10 minutes to read
2026-04-07
Muhammed Aziz
Investing EUR/USD in 2026: Support Levels and Fibonacci on ExpertOption


Trading the EUR/USD pair can feel confusing at first, especially for beginners. Prices move up and down constantly, and it’s easy to feel lost among all the charts and technical indicators. Many new traders struggle to understand why prices move, how to identify key levels, or how to plan trades confidently. At the same time, EUR/USD remains one of the most actively traded currency pairs in the world, often experiencing periods of heightened volatility as economic data and central bank decisions influence market sentiment.
ExpertOption makes this process approachable with a user-friendly platform and simple investing tools. Its intuitive charts allow beginners to see trends clearly, switch between line and candlestick views, draw support and resistance levels, and apply Fibonacci retracements directly on the chart without navigating complex menus. Features like zoom controls, timeframe selection, and clean visual indicators help users focus on market structure and understand price behavior without feeling overwhelmed. Here you can explore the platform and register.
This guide is designed for beginners who want a structured approach to the EUR/USD pair, using support levels and Fibonacci retracements. By the end, you’ll understand how to identify key zones, analyze short-term movements, and apply practical trading examples in 5–15 minute sessions.
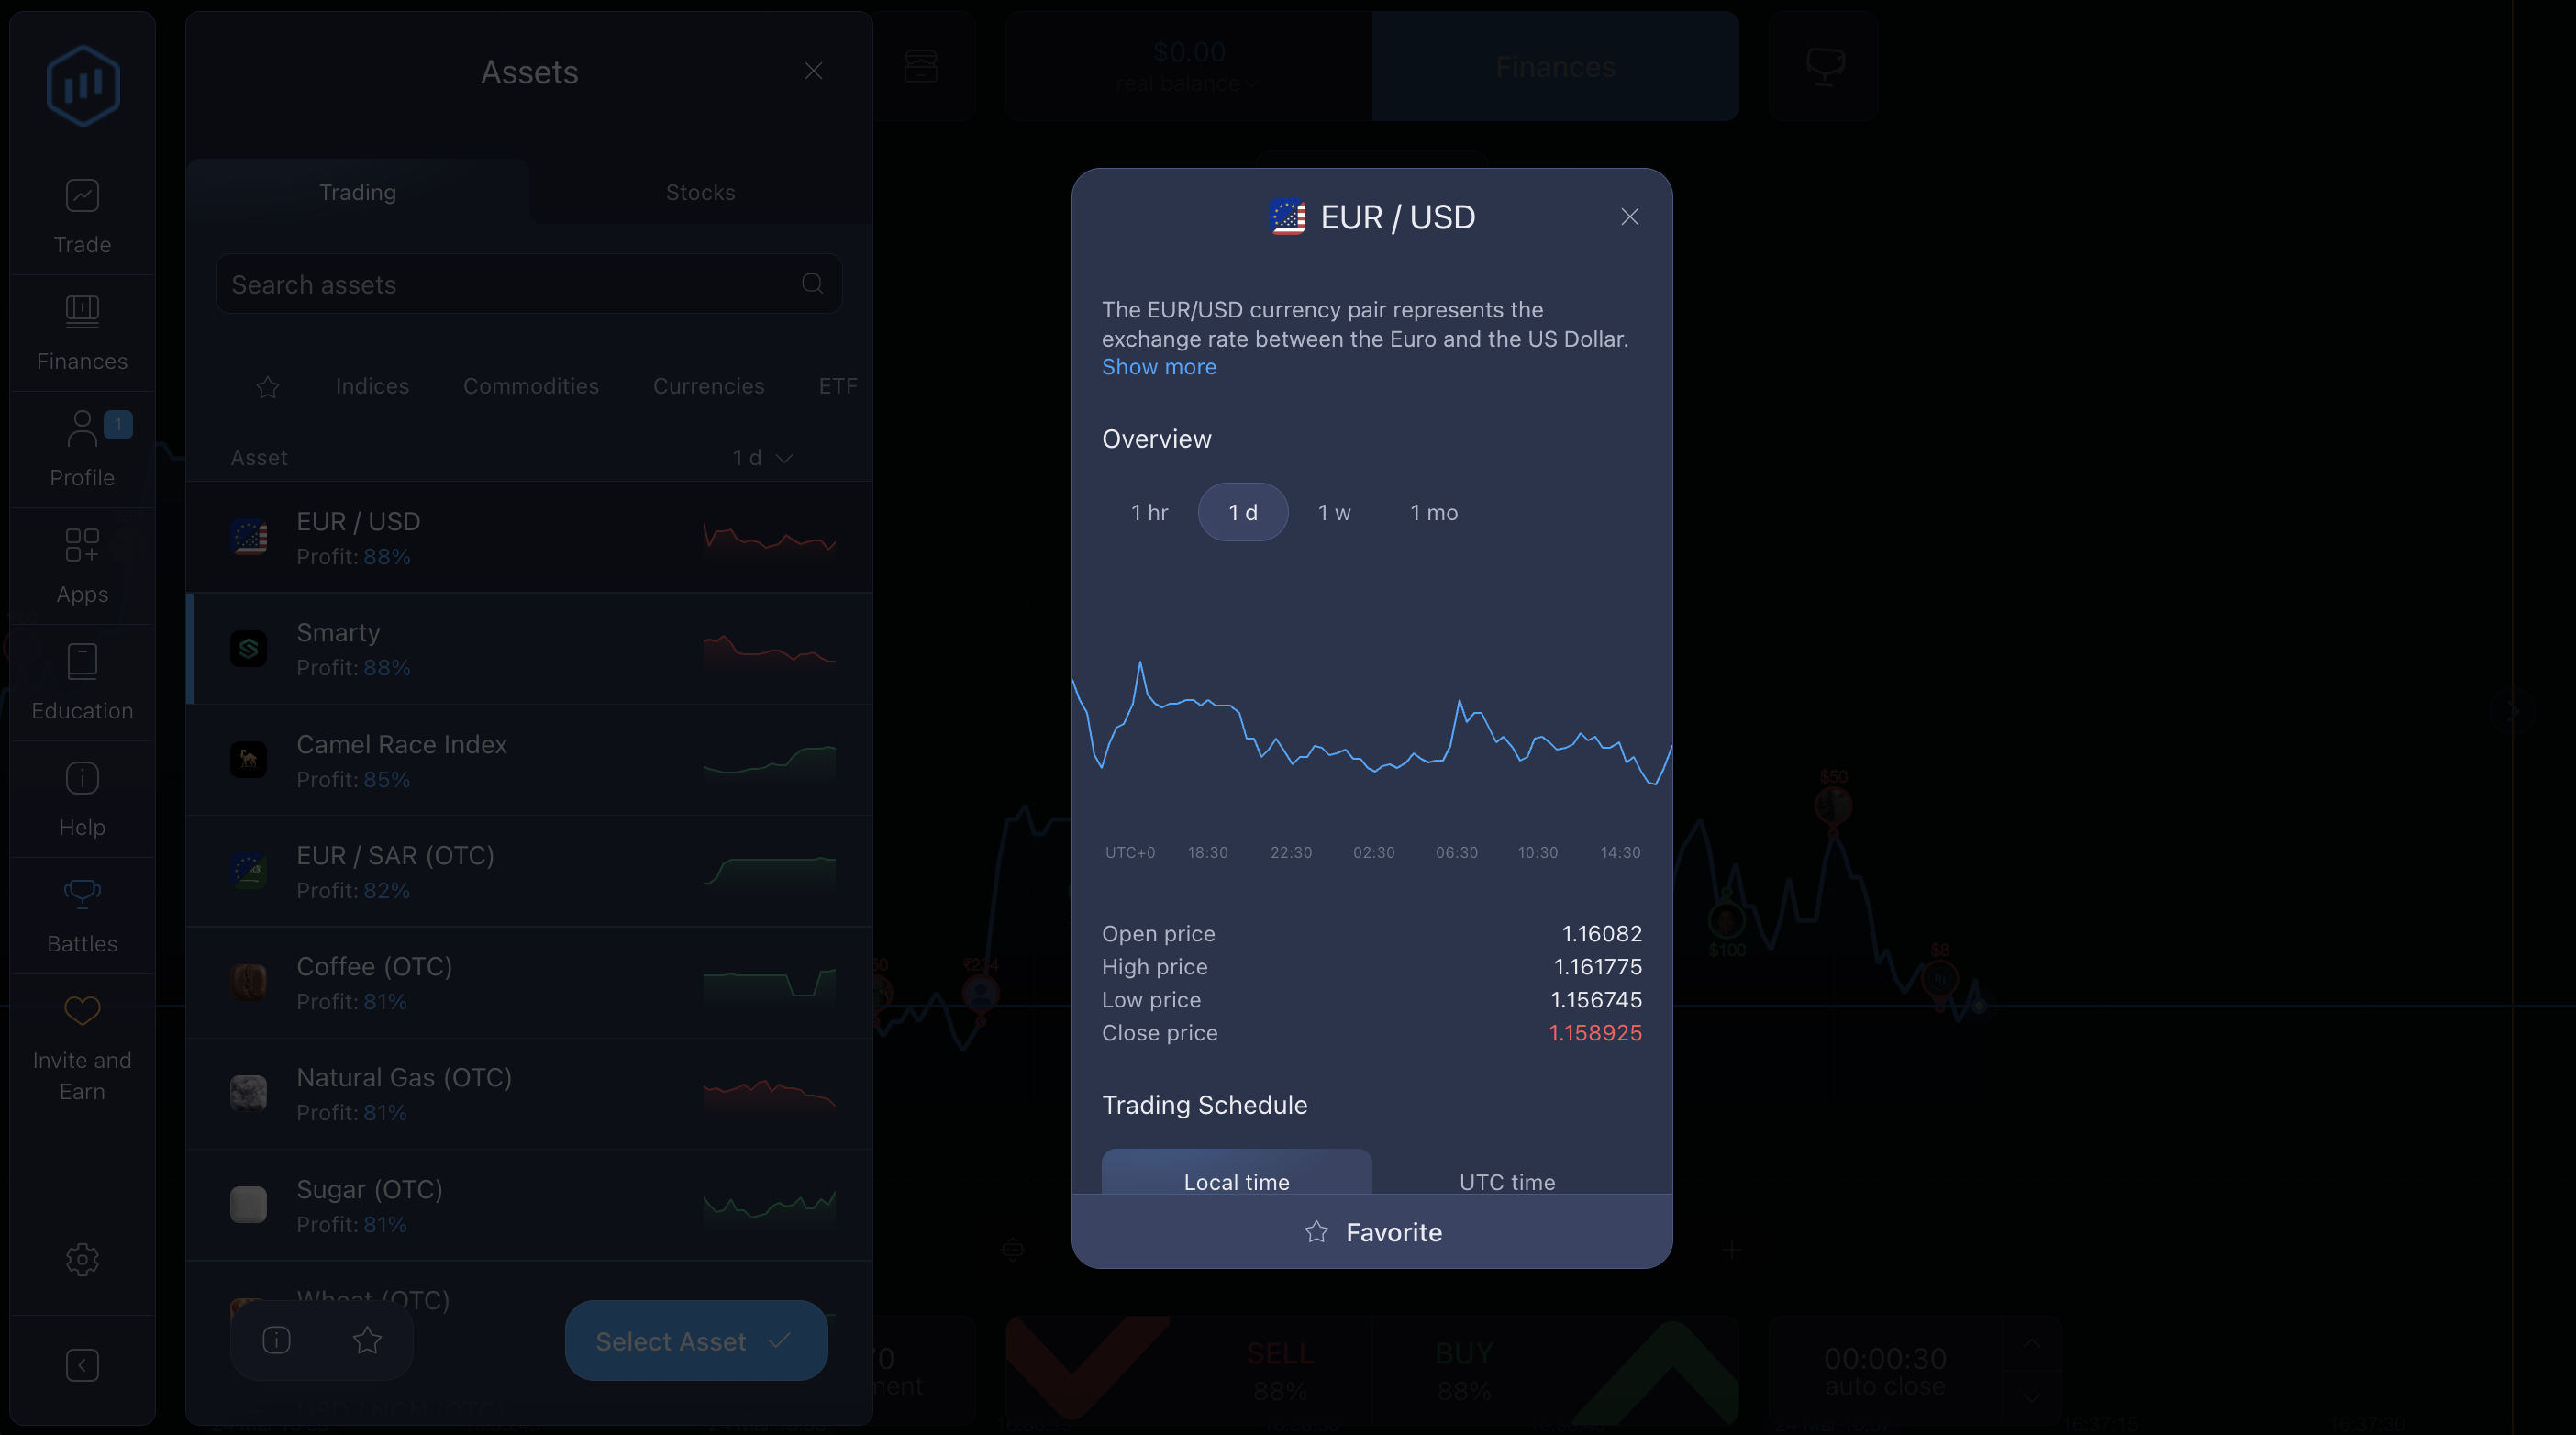
Why Simplicity Matters in EUR/USD Analysis
When you start trading, too many tools and cluttered charts can make it harder to learn. ExpertOption’s beginner-friendly platform simplifies analysis by focusing on the essentials, so you can understand price behavior step by step.
A simplified approach helps you:
- Recognize support and resistance zones clearly
- Understand price trends without distraction
- Observe potential reversals before making decisions
For example, if you focus on a clean chart showing just the price line and key support levels, you’ll see where EUR/USD tends to stop falling or rising. This helps you learn market structure first, instead of guessing or reacting emotionally. By starting simple, you gradually build the skills needed for more advanced analysis.
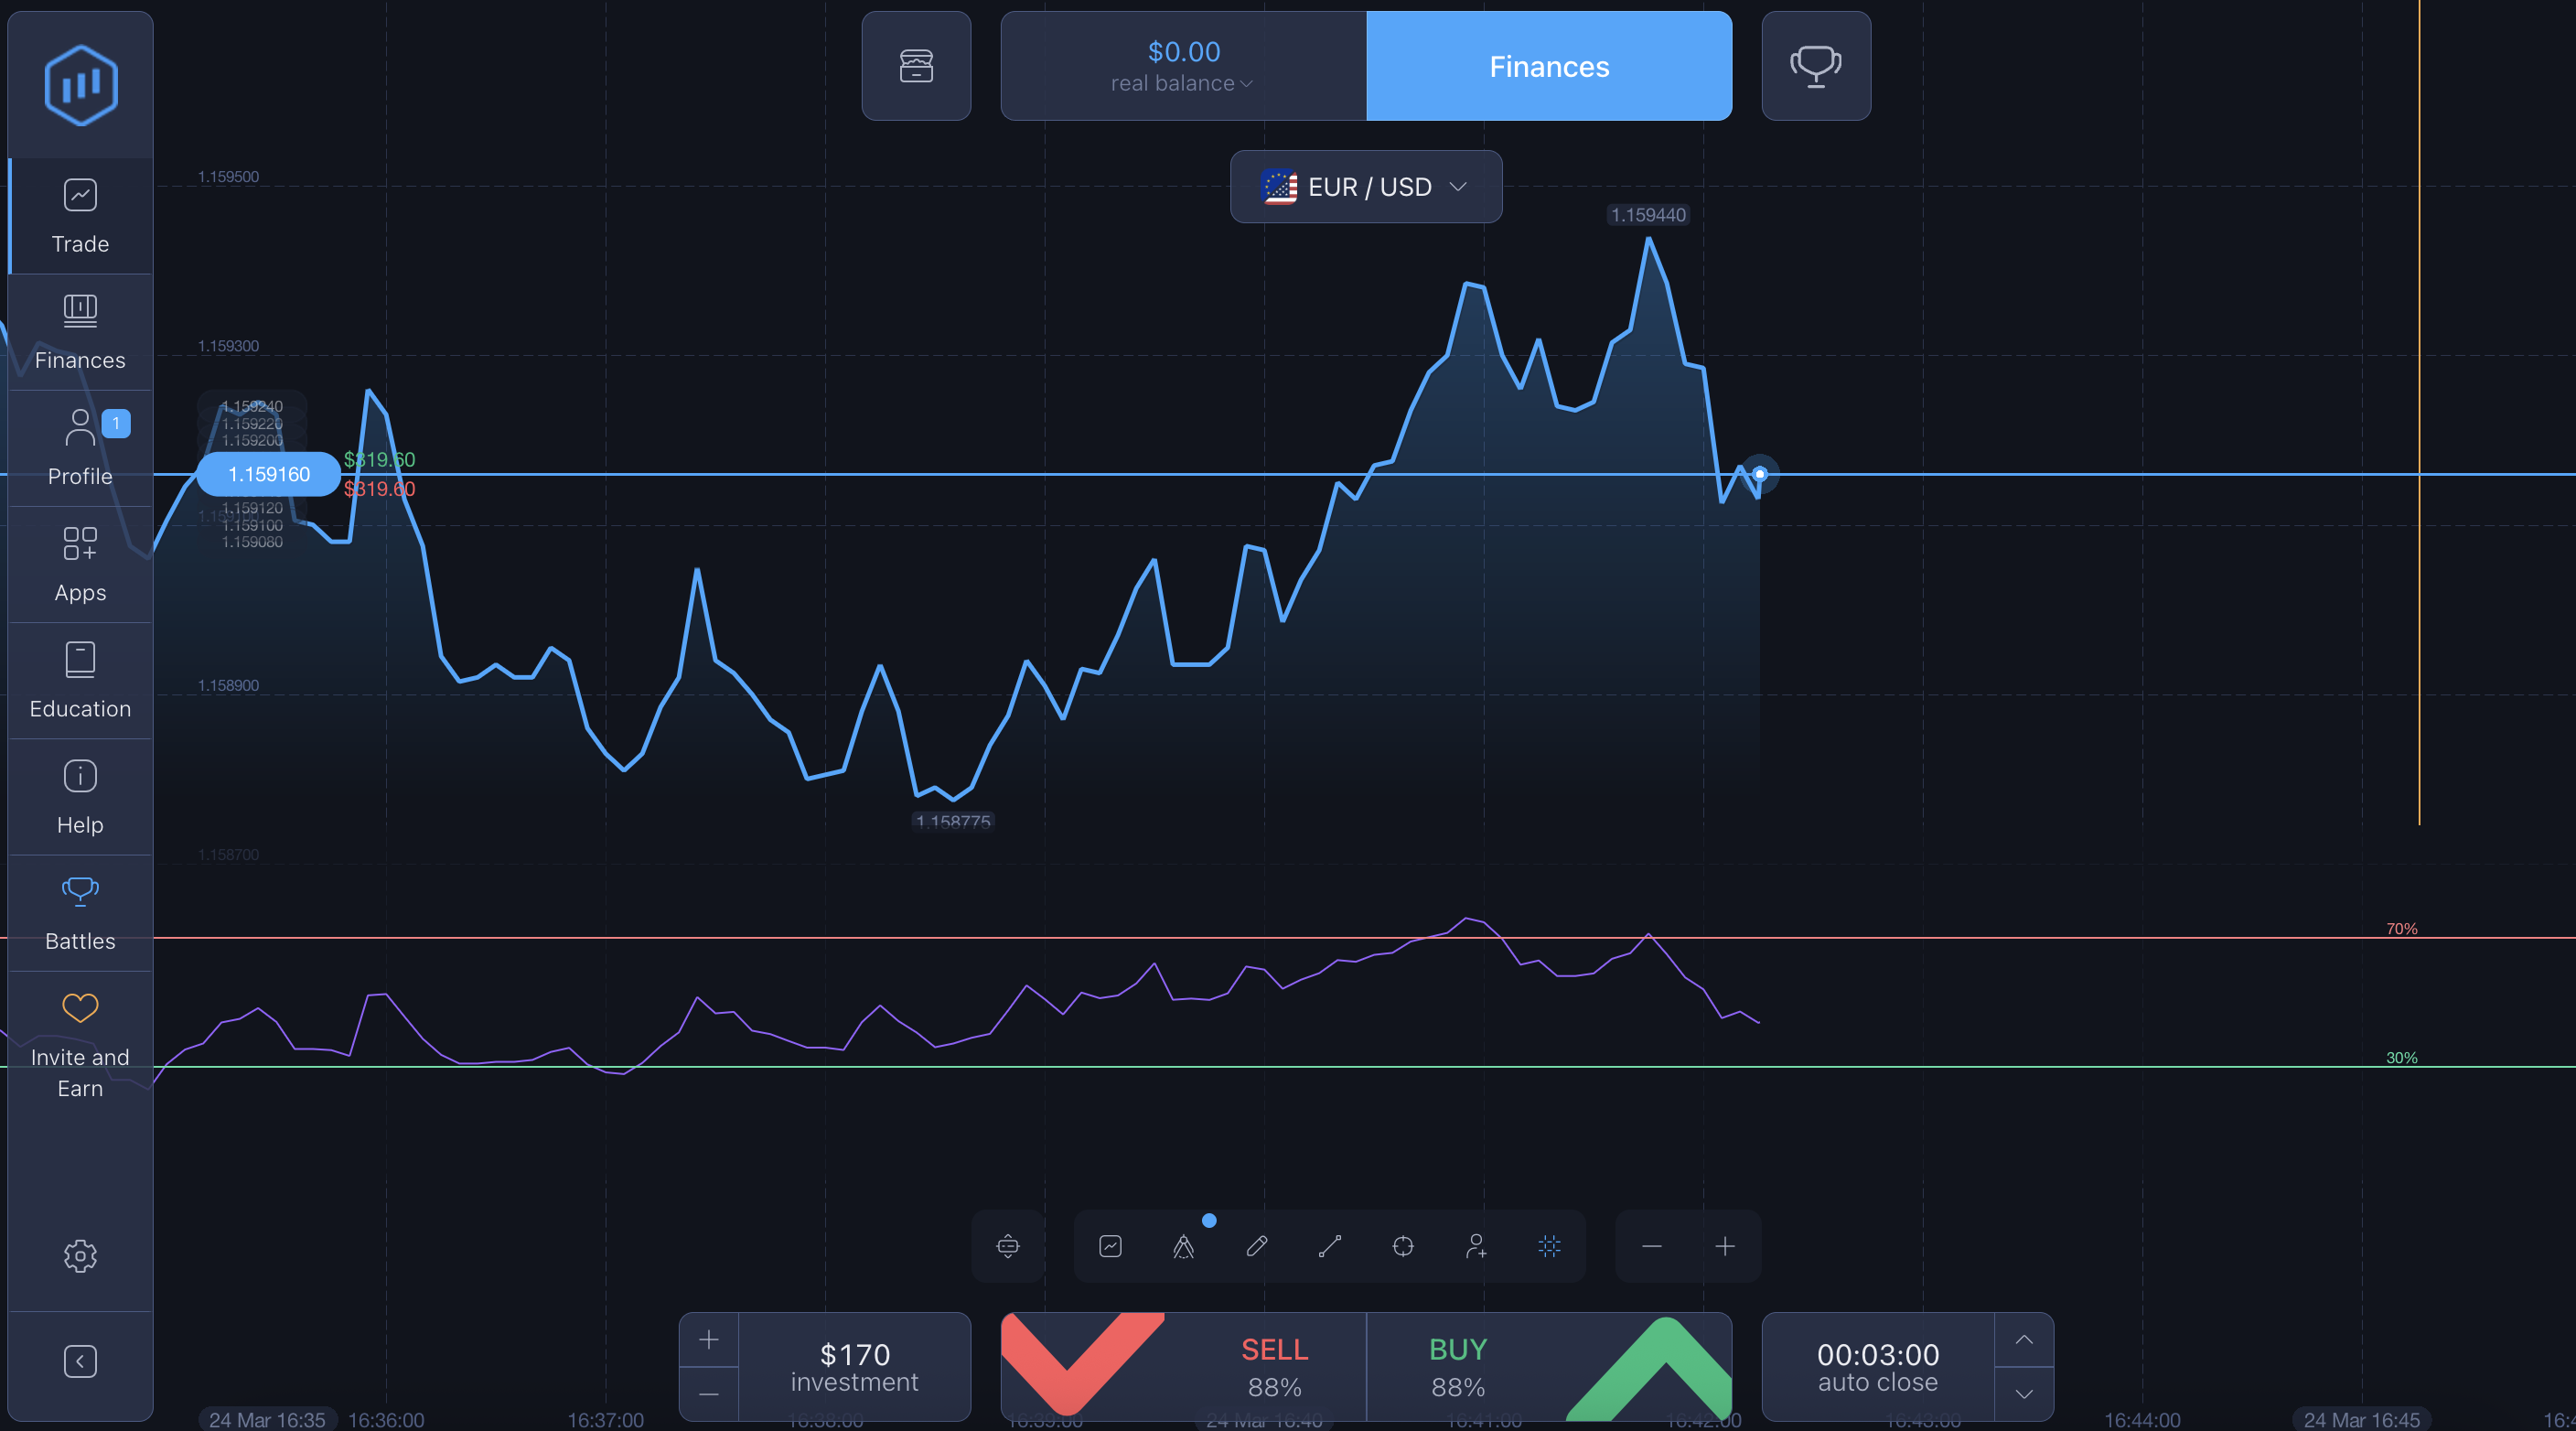
Understanding ExpertOption’s Technical Tools
ExpertOption provides tools specifically designed to help traders analyze the EUR/USD pair without being overwhelmed:
Support and Resistance Levels
Support and resistance are the building blocks of technical analysis.
- Support is a price level where buyers tend to enter, preventing the price from falling further.
- Resistance is where sellers appear, keeping prices from rising.
On platforms like ExpertOption, tools for marking these levels are built directly into the chart, allowing traders to draw lines and visualize key zones without switching between multiple menus or external indicators.
When EUR/USD falls to the same area multiple times and keeps bouncing back, that area acts as support. Beginners learn to spot these zones by watching where the price repeatedly stops falling and reverses.
Fibonacci Retracements
Fibonacci retracements help you identify areas where a price pullback might end and the trend may continue. By connecting a recent low to a subsequent high, the platform generates key levels, such as 38.2%, 50%, and 61.8%. Because many traders watch these same levels, price reactions often occur around them, sometimes creating a self-fulfilling effect where buying or selling activity increases near the retracement zones.
For example, EUR/USD rises from 1.0820 to 1.0900. The 50% retracement at 1.0865 acts as temporary support during a small pullback before the trend continues. Watching these levels teaches beginners why the price reacts in certain zones, giving a more structured way to interpret charts.
ExpertOption’s tools are designed to be intuitive: you can apply support, resistance, and Fibonacci easily without complex menus, making technical charting approachable for everyone. Even traders with no prior charting experience can learn to use these tools in seconds, thanks to the platform’s simple layout and visual controls.
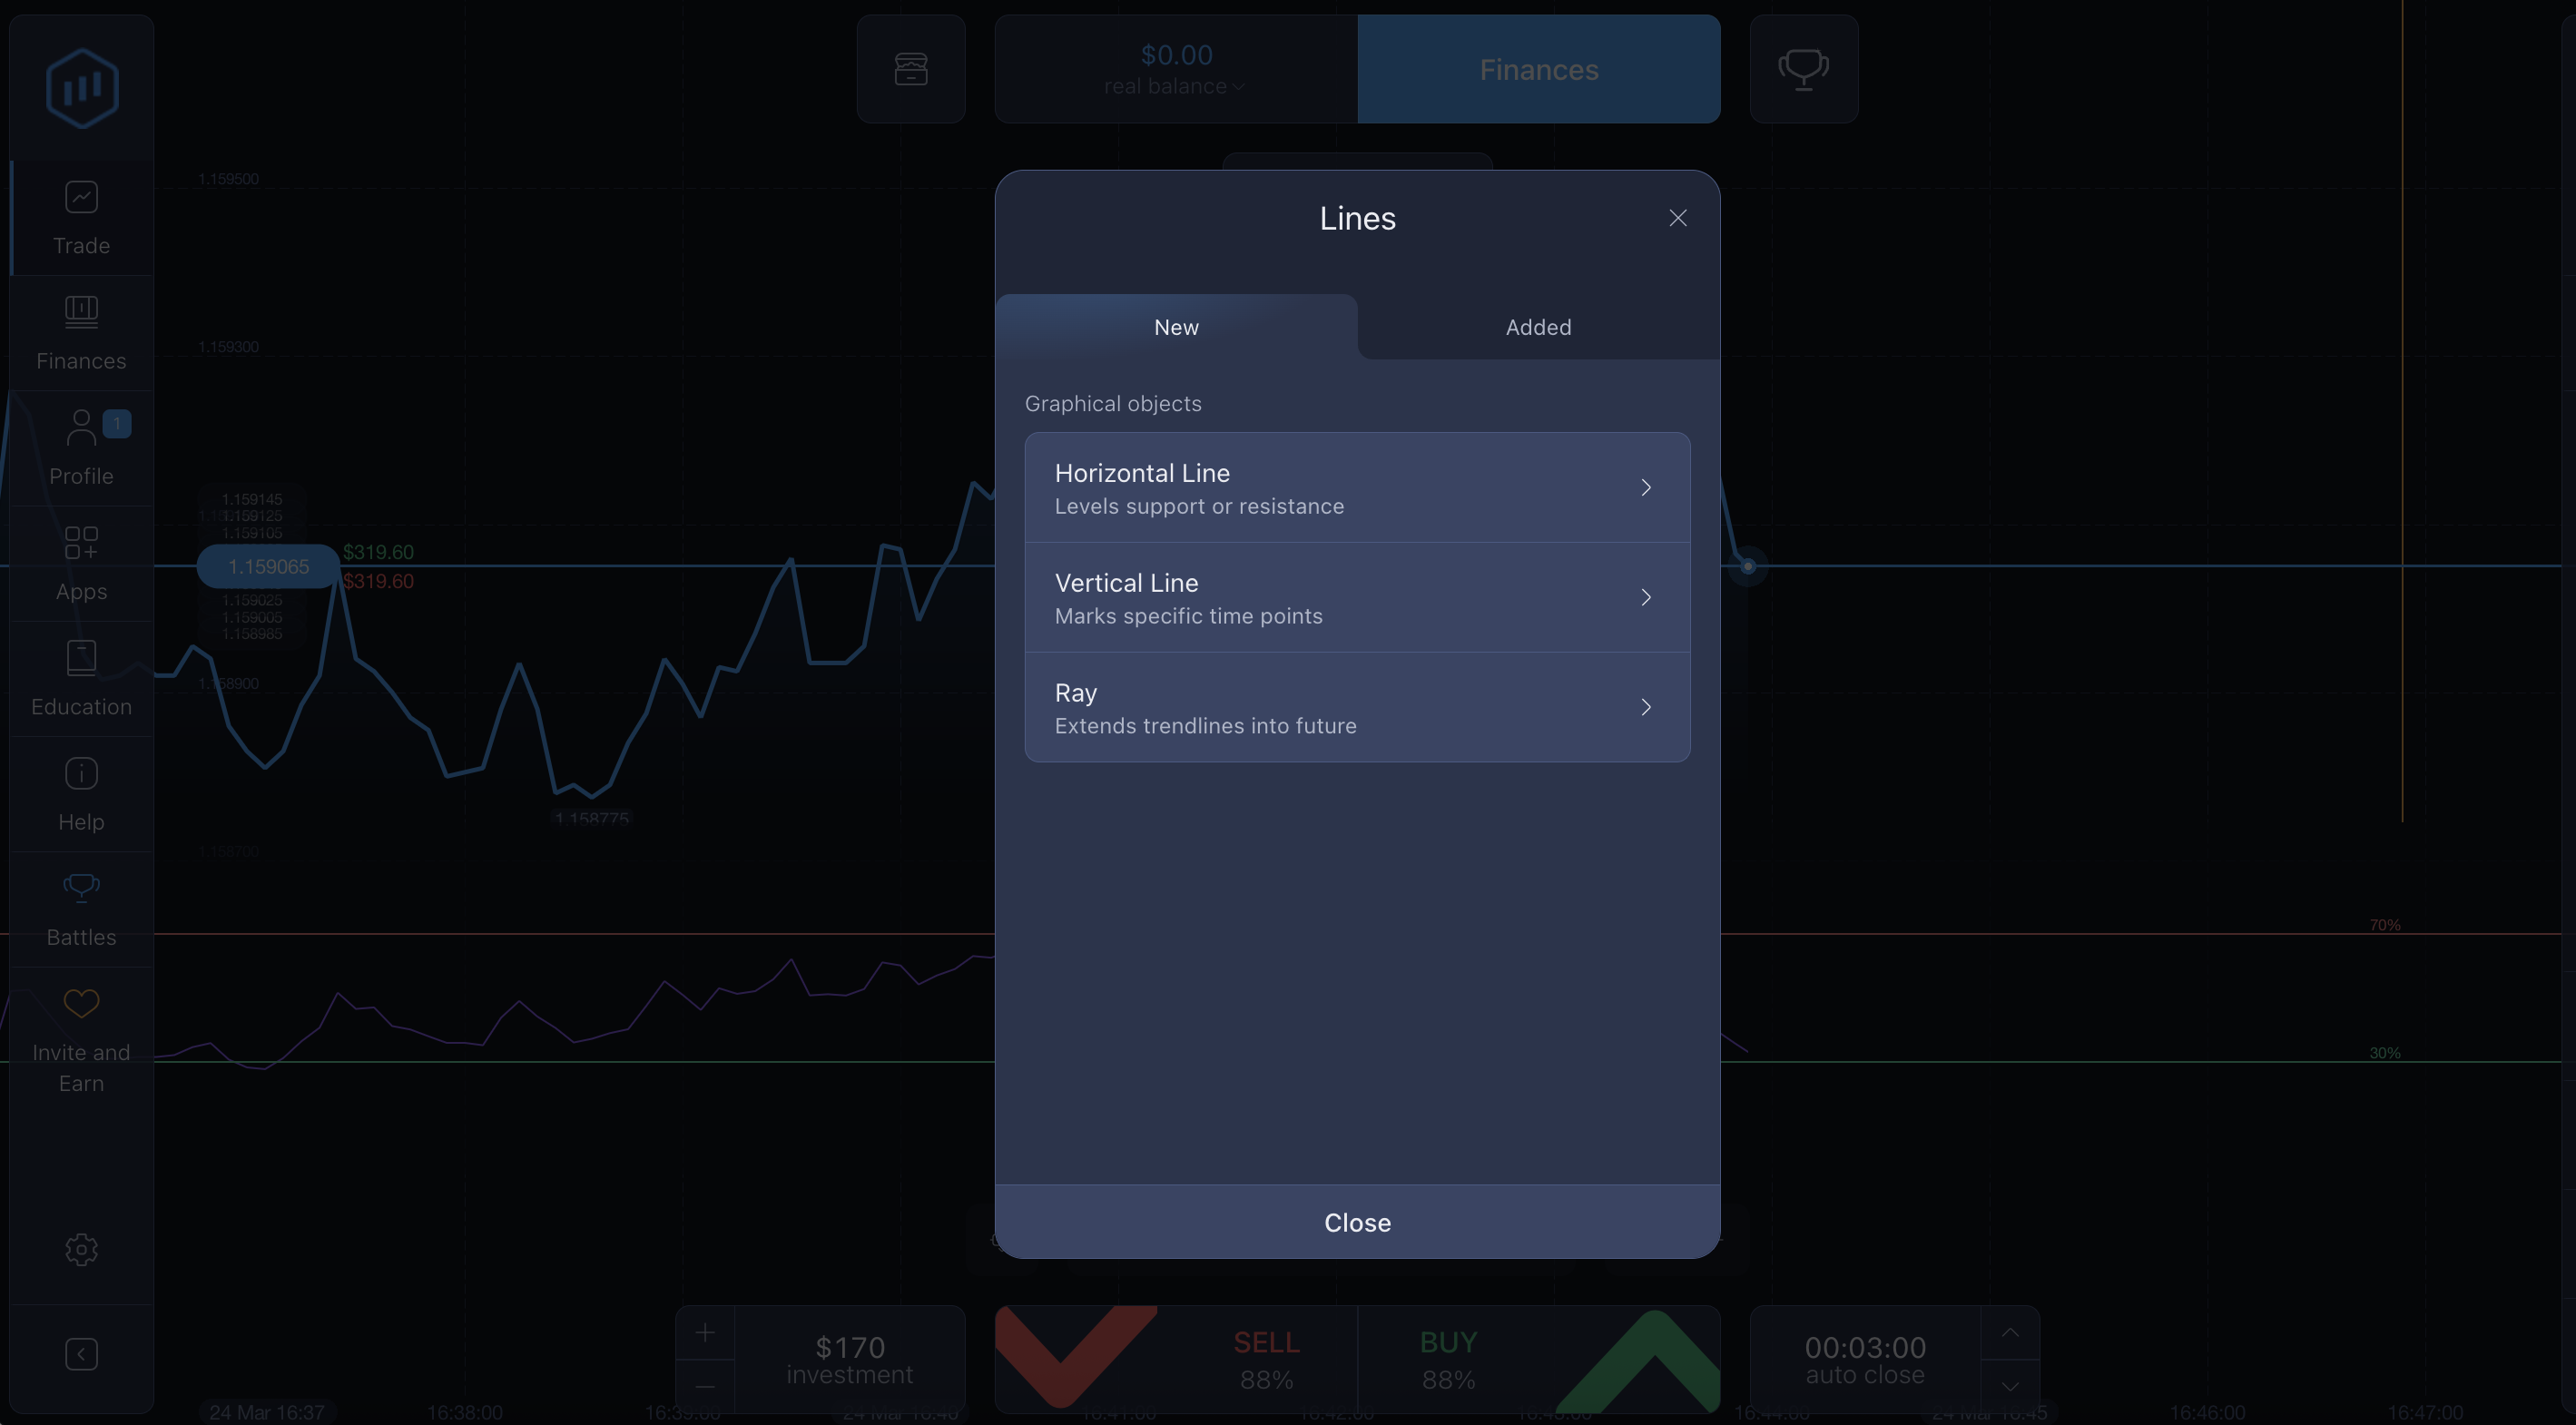
Why an Intuitive Interface Changes Everything
The interface of a trading platform affects how clearly you can understand the market. On ExpertOption, everything is laid out in a way that beginners can follow easily.
When marking support and resistance, a cluttered chart can make you doubt whether a price bounce is real or just a short-term fluctuation. With ExpertOption, these zones are clear and visually obvious. Fibonacci retracements are equally straightforward, helping you see potential reversal points without confusion.
A clean interface also allows you to adjust charts according to your own strategy and risk tolerance. For example, you might combine a candlestick chart with support levels and a trendline to track short-term EUR/USD movements. This clarity builds confidence and reduces errors caused by misreading cluttered charts.
By removing distractions, ExpertOption lets you focus on understanding market behavior, observing price reactions, and developing structured trading habits, rather than just clicking randomly. This environment also helps traders build discipline, encouraging them to analyze setups carefully and approach each trade with a clearer plan.
Key Benefits of a Simplified EUR/USD Trading Experience
A simplified approach makes learning to trade much more approachable. Beginners benefit in several ways:
- Faster trend recognition: Clear charts make it easier to see when EUR/USD is moving up, down, or sideways.
- Better understanding of support and resistance: Beginners can see exactly where the price has bounced before and anticipate future reactions.
- Structured workflow: Focusing on a few essential tools at a time avoids information overload.
- Increased confidence: Watching how price interacts with Fibonacci retracements and support zones helps you trust your market analysis.
For example, during a 15-minute session, if EUR/USD pulls back to a 50% Fibonacci level and bounces, you can visually connect the retracement to real market behavior. Similarly, observing price repeatedly testing a support zone over 5 minutes teaches you how markets respond to buying and selling pressure.
By keeping analysis simple and visual, ExpertOption allows beginners to build understanding, not just follow signals, making learning more meaningful and less intimidating.
Who Should Follow This Guide
This guide is especially useful for:
- Beginners who feel overwhelmed by multiple indicators
- Traders struggling to identify accurate support and resistance levels
- Anyone who wants a structured, step-by-step approach to market analysis
- Users aiming to understand the EUR/USD behavior through observation rather than guessing
The goal is to give beginners a clear path to understand price behavior, recognize patterns, and apply practical tools confidently. ExpertOption’s user-friendly platform and simple investing tools make this possible. Our blog offers extensive resources to address common questions.
Common Mistakes to Avoid
Many beginners make mistakes that slow their learning. Common issues include:
- Using too many indicators too early: Jumping into advanced tools before understanding basic price behavior can cause confusion. Beginners should focus first on support, resistance, and Fibonacci retracements.
- Ignoring simple features: Line charts, clearly marked support zones, and retracement levels are powerful learning tools. Overlooking them may cause misinterpretation of market movements.
- Acting without understanding: Emotional decisions often result from watching the price move without a framework. Observing how the price reacts at support or retracement levels first builds context and reduces emotional trading.
- Ignoring the timeframe context: Looking at only one short timeframe can hide the bigger picture. A price move that looks like a strong trend on a 1-minute chart might simply be a small pullback on a longer timeframe.
By keeping analysis structured and visual, beginners learn to read price behavior logically, rather than reacting impulsively. For instance, observing a support level during a 5-minute session teaches patterns more reliably than flipping between multiple confusing indicators.
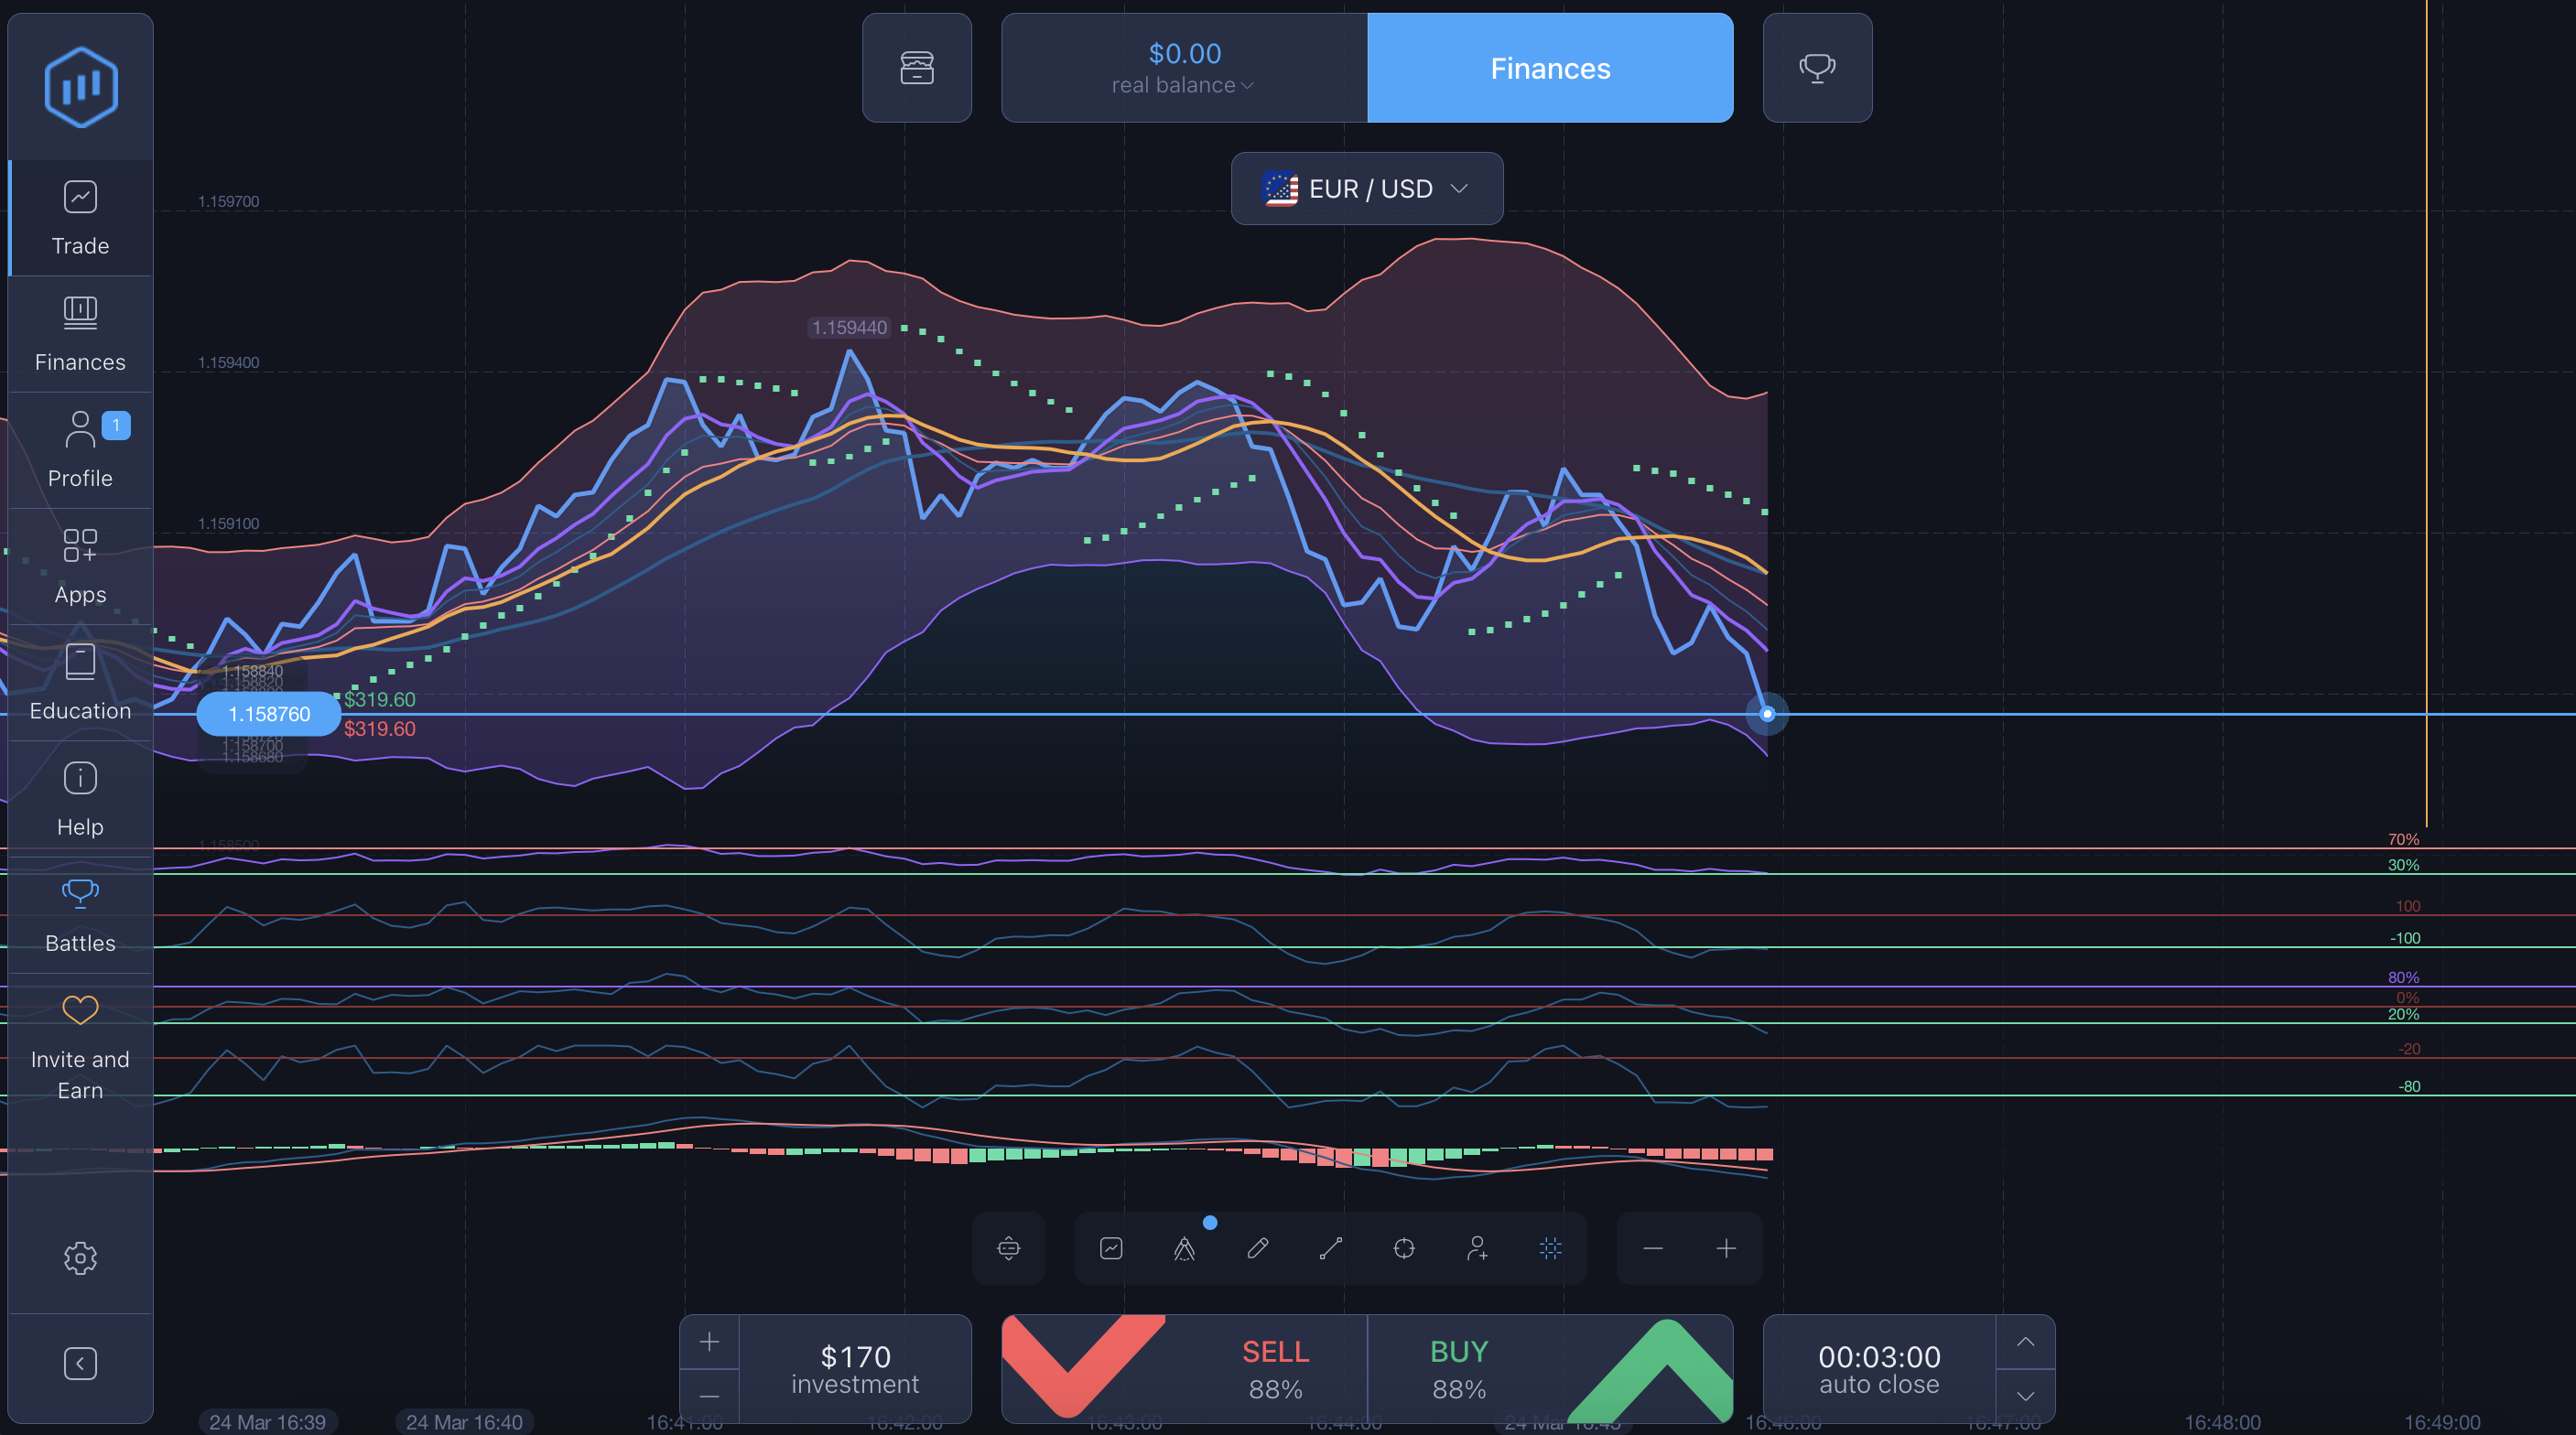
Practical 5–15 Minute EUR/USD Trading Examples
Example 1: 5-Minute Session
EUR/USD tests a support level at 1.0830. Price bounces twice, confirming it as a valid zone. Using a line chart on ExpertOption, you can clearly see the trend and observe how the price reacts to the support, helping beginners understand why prices reverse at certain levels.
Example 2: 15-Minute Session
EUR/USD rises from 1.0820 to 1.0900. Applying Fibonacci retracement, the 50% level at 1.0865 acts as temporary support. Price pauses at this level before continuing upward, illustrating how retracements provide a roadmap for potential market behavior.
These scenarios show how even short sessions can provide structured learning. By observing reactions to support and retracement levels, beginners build understanding and confidence in their analysis.
FAQ
Can chart types change market prices?
No. Charts only display the same market data differently. Line charts show closing prices for a smooth trend, while candlesticks display the full price range, highlighting short-term volatility. Both represent the same market.
Which chart is best for beginners?
Line charts are simple and show the overall direction of trends clearly. Candlestick charts are introduced later to show more detail about short-term price movements.
What time frame is best for beginners?
Many beginners start with medium timeframes such as 5-minute, 15-minute, or 1-hour charts, because they balance clarity and activity. Very short timeframes can look chaotic, while longer ones help traders see trends, support levels, and price structure more clearly.
Can chart customization affect results?
Customization improves readability but does not affect the market. Adjusting colors, zoom levels, or timeframes helps beginners see key support and Fibonacci levels more clearly.
Does ExpertOption alter chart data?
No. Charts reflect real-time prices from liquidity providers. ExpertOption displays the data without modifying it, allowing users to rely on accurate market information.
How do Fibonacci retracements help trading decisions?
Fibonacci retracements highlight potential reversal points based on prior price swings. Beginners can observe where the price may pull back before continuing a trend.
How do support and resistance levels improve market understanding?
Support and resistance show areas where the market has reacted in the past. Observing these reactions teaches beginners how trends and reversals form, reducing emotional trading and building confidence in market analysis.
Conclusion
Analyzing EUR/USD in 2026 becomes manageable with a beginner-friendly platform like ExpertOption. By using support levels, Fibonacci retracements, and clear charts, beginners can understand price behavior, identify key zones, and structure their analysis effectively.
With simple, visual tools and an intuitive interface, even short sessions provide opportunities to learn market patterns. Over time, this approach helps beginners develop confidence, strengthen analytical skills, and understand trading as a structured, skill-based process rather than a guessing game. With regular practice, traders can gradually progress from simply observing the market to making more confident, structured decisions.
Latest Posts
Trading Education
Trading News
Trading Strategies
Promotions & Tournaments
Success Stories & Tips
Platform Updates
Global events, stocks, crypto, forex
ExpertOption Reviews: An Honest Overview and Tips from Traders
5 minutes to readExpertOption Withdrawal Policy: How Withdrawals Work and Why Balance Management Matters
5 minutes to readExpertOption Reviews: An Honest Overview and Tips from Traders
5 minutes to readExpertOption Withdrawal Policy: How Withdrawals Work and Why Balance Management Matters
5 minutes to read